|
|
8 달 전 | |
|---|---|---|
| .. | ||
| .vscode | 9 달 전 | |
| apps | 8 달 전 | |
| docs | 9 달 전 | |
| .lintr | 9 달 전 | |
| README.md | 9 달 전 | |
| qhtcp-workflow | 8 달 전 | |
| qhtcp-workflow.code-workspace | 9 달 전 | |
README.md
Hartman Lab QHTCP Workflow
An opinionated yet flexible QHTCP analysis framework for the Hartman Lab.
Overview
See the User Input section for getting started.
Insert a general description of Q-HTCP and the Q-HTCP process here.
Index
- parse_input
- install_dependencies
- init_project
- easy
- ezview
- qhtcp
- remc
- gtf
- gta
- r_gta
- r_gta_pairwiselk
- r_gta_heatmaps
- r_interactions
- r_join_interactions
- java_extract
- r_add_shift_values
- r_create_heat_maps
- r_heat_maps_homology
- py_gtf_dcon
- pl_gtf_analyze
- pl_gtf_terms2tsv
- py_gtf_concat
- r_compile_gtf
- study_info
- choose_easy_results
Notes
TODO
- Variable scoping is horrible right now
- I wrote this sequentially and tried to keep track the best I could
- Local vars have a higher likelihood of being lower case, global vars are UPPER
- See MODULE specific TODOs below
General guidelines for writing external scripts
- External scripts must be modular enough to handle input and output from multiple directories
- Don't cd in scripts (if you must, do it in a subshell!)
- Pass variables
- Pass options
- Pass arguments
Project layout
qhtcp-workflow/
scans/
- This directory contains raw image data and image analysis results for the entire collection of Q-HTCP experiments.
- Subdirectories within "scans" should represent a single Q-HTCP study and be named using the following convention: yyymmdd_username_experimentDescription
- Each subdirectory contains the Raw Image Folders for that study.
- Each Raw Image Folder contains a series of N folders with successive integer labels 1 to N, each folder containing the time series of images for a single cell array.
- It also contains a user-supplied subfolder, which must be named "MasterPlateFiles" and must contain two excel files, one named 'DrugMedia_experimentDescription' and the other named 'MasterPlate_experimentDescription'.
- If the standard MasterPlate_Template file is being used, it's not needed to customize then name.
- If the template is modified, it is recommended to rename it and describe accordingly - a useful convention is to use the same experimentDescription for the MP files as given to the experiment
- The 'MasterPlate' file contain associated cell array information (culture IDs for all of the cell arrays in the experiment) while the 'DrugMedia' file contains information about the media that the cell array is printed to.
- Together they encapsulate and define the experimental design.
- The QHTCPImageFolders and 'MasterPlateFiles' folder are the inputs for image analysis with EASY software.
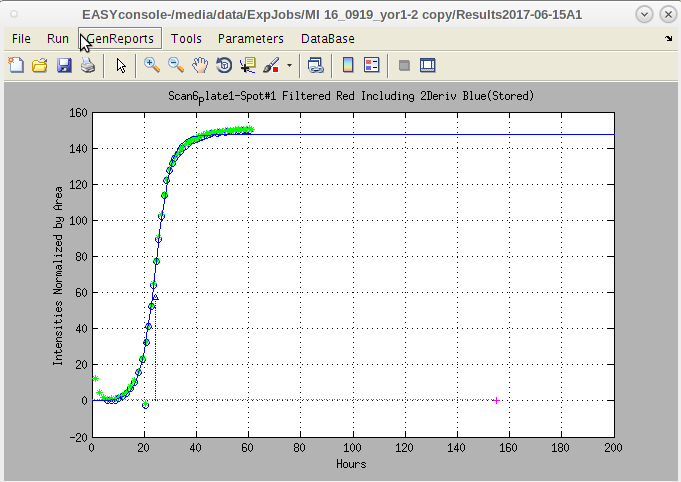
- As further described below, EASY will automatically generate a 'Results' directory (within the ExpJobs/'ExperimentJob' folder) with a name that consists of a system-generated timestamp and an optional short description provided by the user (Fig.2). The 'Results' directory is created and entered, using the "File >> New Experiment" dropdown in EASY. Multiple 'Results' files may be created (and uniquely named) within an 'ExperimentJob' folder.
apps/easy/
- This directory contains the GUI-enabled MATLAB software to accomplish image analysis and growth curve fitting.
- EASY analyzes Q-HTCP image data within an 'ExperimentJob'' folder (described above; each cell array has its own folder containing its entire time series of images).
- EASY analysis produces image quantification data and growth curve fitting results for each cell array; these results are subsequently assembled into a single file and labeled, using information contained in the 'MasterPlate' and 'DrugMedia' files in the 'MasterPlateFiles' subdirectory.
- The final files (named '!!ResultsStd.txt' or '!!ResultsELr.txt') are produced in a subdirectory that EASY creates within the 'ExpJob#' folder, named '/ResultsTimeStampDesc/PrintResults' (Fig. 2).
- The /EASY directory is simply where the latest EASY version resides (additional versions in development or legacy versions may also be stored there).
- The raw data inputs and result outputs for EASY are kept in the 'ExpJobs' directory.
- EASY also outputs a '.mat' file that is stored in the 'matResults' folder and is named with the TimeStamp and user-provided name appended to the 'Results' folder name when 'New Experiment' is executed from the 'File' Dropdown menu in the EASY console.
apps/ezview/
- This directory contains the GUI-enabled MATLAB software to conveniently and efficiently mine the raw cell array image data for a Q-HTCP experiment.
- It takes the Results.m file (created by EASY software) as an input and permits the user to navigate through the raw image data and growth curve results for the experiment.
- The /EZview provides a place for storing the the latest EZview version (as well as other EZview versions).
- The /EZview provides a GUI for examining the EASY results as provided in the …/matResults/… .mat file.
Master Plates
- This optional folder is a convenient place to store copies of the 'MasterPlate' and a 'DrugMedia' file templates, along with previously used files that may have been modified and could be reused or further modified to enable future analyses.
- These two file types are required in the 'MasterPlateFiles' folder, which catalogs experimental information specific to individual Jobs in the ExpJobs folder, as described further below.
parse_input
--project, --module, --nomodule, and --wrapper can be passed multiple times or with a comma-separated string
Options
- -p<value> | --project=<value>
One or more projects to analyze, can be passed multiple times or with a comma-separated string
- -m<value> | --module=<value>
One or more modules to run (default: all), can be passed multiple times or with a comma-separated string
- -w<value> | --wrapper=<value>
Requires two arguments: the name of the wrapper and its arguments, can be passed multiple times
- -n<value> | --nomodule=<value>
One or more modules (default: none) to exclude from the analysis
- --markdown
Generate the shdoc markdown file for this program
- -y | --yes | --auto
Assume yes answer to all questions (non-interactive mode)
- -d | --debug
Turn on extra debugging output
- -h | --help
Print help message and exit (overrides other options)
Variables set
- PROJECTS (array): List of projects to cycle through
- MODULES (array): List of modules to run on each project
- WRAPPERS (array): List of wrappers and their arguments to run on each project
- EXCLUDE_MODULES (array): List of modules not to run on each project
- DEBUG (int): Turn debugging on
- YES (int): Turn assume yes on
Modules
A module contains a cohesive set of actions/experiments to run on a project
Use a module to:
- Build a new type of analysis from scratch
- Generate project directories
- Group multiple wrappers (and modules) into a larger task
- Dictate the ordering of multiple wrappers
- Competently handle pushd and popd for their wrappers if they do not reside in the SCANS/PROJECT_DIR
- Call their wrappers with the appropriate arguments
install_dependencies
This module will automatically install the dependencies for running QHTCP.
If you wish to install them manually, you can use the following information to do so:
System dependencies
- R
- Perl
- Java
- MATLAB
MacOS
export HOMEBREW_BREW_GIT_REMOTE=https://github.com/Homebrew/brew/bin/bash -c "$(curl -fsSL https://raw.githubusercontent.com/Homebrew/install/HEAD/install.sh)"cpan File::Map ExtUtils::PkgConfig GD GO::TermFinderbrew install graphiz gd pdftk-java pandoc shdoc nano rsync coreutils
Linux DEB
apt install graphviz pandoc pdftk-java libgd-dev perl shdoc nano rsync coreutils libcurl-dev openssl-dev
Linux RPM
dnf install graphviz pandoc pdftk-java gd-devel perl-CPAN shdoc nano rsync coreutils libcurl-devel openssl-devel
Perl
cpan -I -i File::Map ExtUtils::PkgConfig GD GO::TermFinder
R
install.packages(c('BiocManager', 'ontologyIndex', 'ggrepel', 'tidyverse', 'sos', 'openxlsx', 'ggplot2', 'plyr', 'extrafont', 'gridExtra', 'gplots', 'stringr', 'plotly', 'ggthemes', 'pandoc', 'rmarkdown', 'plotly', 'htmlwidgets'), dep=TRUE)BiocManager::install('UCSC.utils')BiocManager::install('org.Sc.sgd.db')
init_project
This function creates and initializes project directories
This module:
- Initializes a project directory in the scans directory
:bulb: TODO
- Copy over source image directories from robot
- MasterPlate_ file should not be an xlsx file, no portability
- We can keep the existing xlsx code for old style fallback
- But moving forward should switch to csv or something open
- Do we need to sync a QHTCP template?
:memo: NOTES
- Copy over the images from the robot and then DO NOT TOUCH that directory except to copy from it
- Write-protect (read-only) if we need to
- Copy data from scans/images directory to the project working dir and then begin analysis
- You may think...but doesn't that 2x data?
- No, btrfs subvolume uses reflinks, only data that is altered will be duplicated
- Most of the data are static images that are not written to, so the data is deduplicated
easy
Run the EASY matlab program
INPUT FILES
- MasterPlate_.xls
- DrugMedia_.xls
OUTPUT FILES
- !!ResultsStd_.txt
- !!ResultsELr_.txt
TODO
- Don't create output in the scans folder, put it in an output directory
- The !!Results output files need standardized naming
- The input MasterPlate and DrugMedia sheets need to be converted to something standard like csv/tsv
- This would allow them to be created programmatically as well
NOTES
- I've modularized EASY to fit into this workflow but there may be things broken (especially in "stand-alone" mode)
- The scans/images and 'MasterPlateFiles' folder are the inputs for image analysis with EASY software.
- EASY will automatically generate a 'Results' directory (within the ExpJobs/'ExperimentJob' folder) w/ timestamp and an optional short description provided by the user (Fig.2).
- The 'Results' directory is created and entered, using the "File >> New Experiment" dropdown in EASY.
- Multiple 'Results' files may be created (and uniquely named) within an 'ExperimentJob' folder.
INSTRUCTIONS
- This program should handle the relevant directory and file creation and load the correct project into EASY
Pin-tool mapping
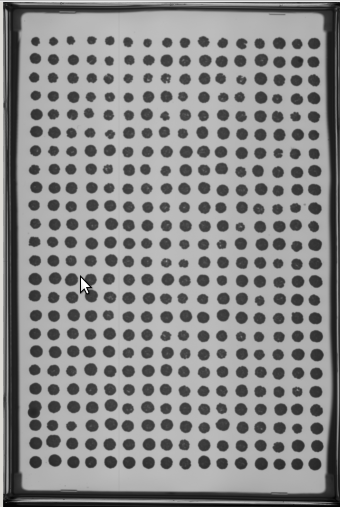
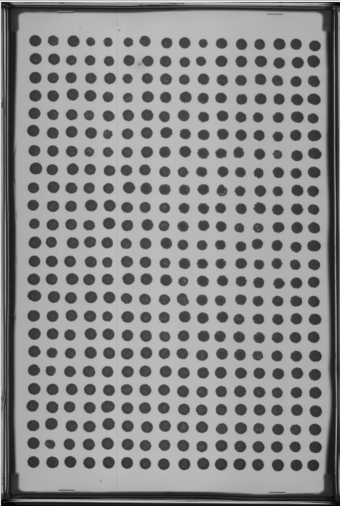
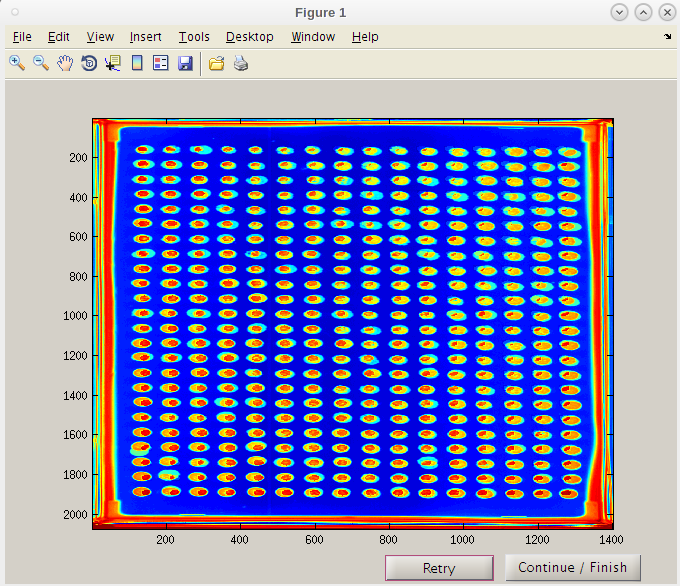
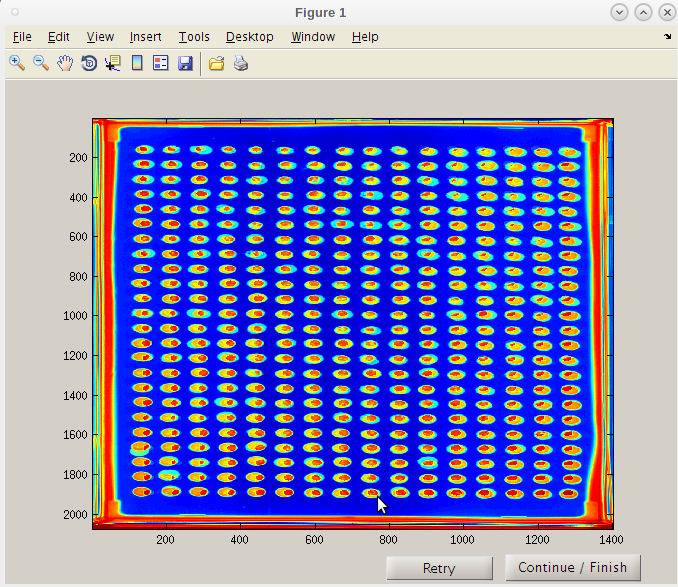
- Select at least two images from your experiment (or another experiment) to place in a 'PTmapFiles' folder.
- Sometimes an experiment doesn't have a complete set of quality spots for producing a pin tool map that will be used to start the spot search process.
- In this case the folder for Master Plate 1 (MP 1) is almost good but has a slight problem.
- At P13 the spot is extended. We might use this one but would like to include others that are more centered if possible.
- The other plates with higher drug concentrations could be used, but since a recent experiment has a better reference plate image, we will add it to the set of images to produce the pin tool map.
- We will find a good image from another experiment
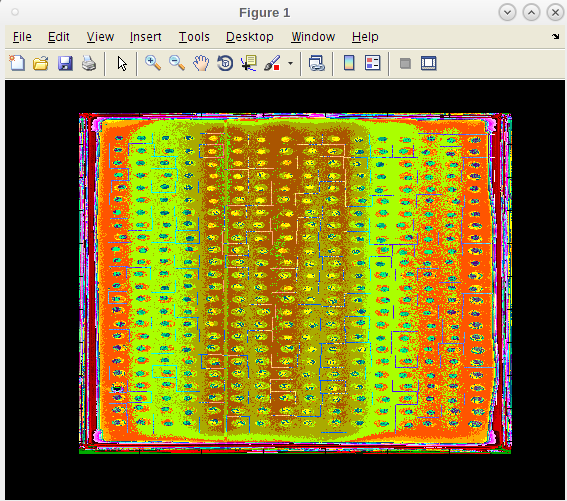
- We now have some images to generate a composite centered map for EASY to search and find the nucleation area of each spot as it forms.
- Click the Run menu tab.
- A drop down list of options is presented.
- Click the first item → [Plate Map Pintool ].
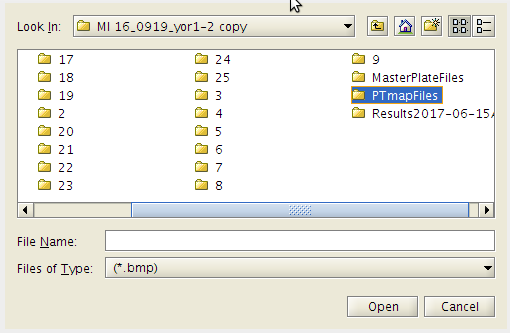
- Open the PTmapFiles folder.
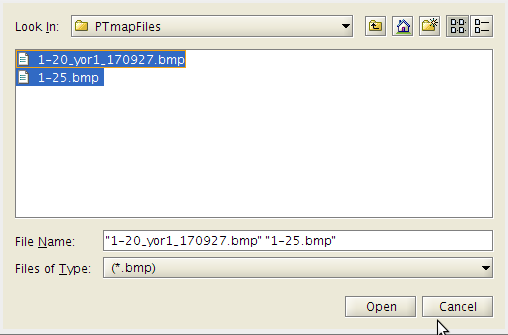
- Then click on the .bmp files you wish to include to make the pin tool map.
- Click the Open button.
- A warning dialog box may appear.
- This is nothing to be concerned about.
- Click OK and continue.
- 'Retry' takes you back so that to can select a different .bmp files from which to create the map from.
- In this case the spots from the two images are well aligned and give coverage to all the spots therefore we do not have to add new images.
- Remember, this map is just a good guess as to where to start looking for each spot not where it will focus to capture intensities.
- Click 'Open' again.
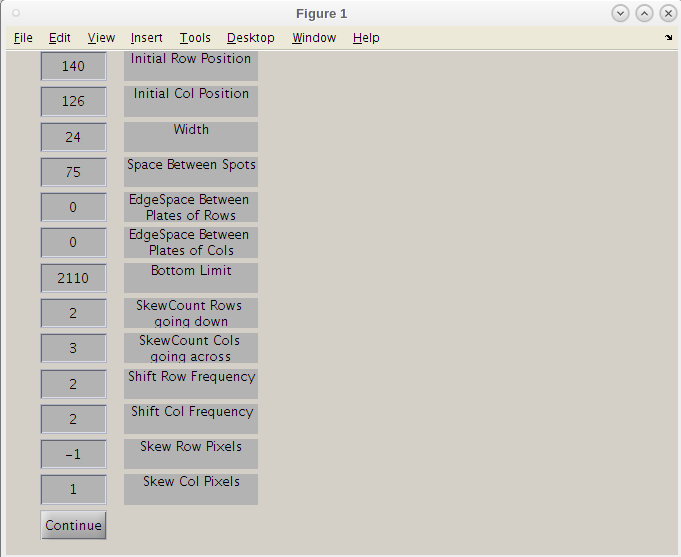
- We can now shift these values to get a better 'hard' start for this search.
- Maybe we can move this search point to the left a bit by decreasing the 'Initial Col Position' slightly to 120 and clicking continue.
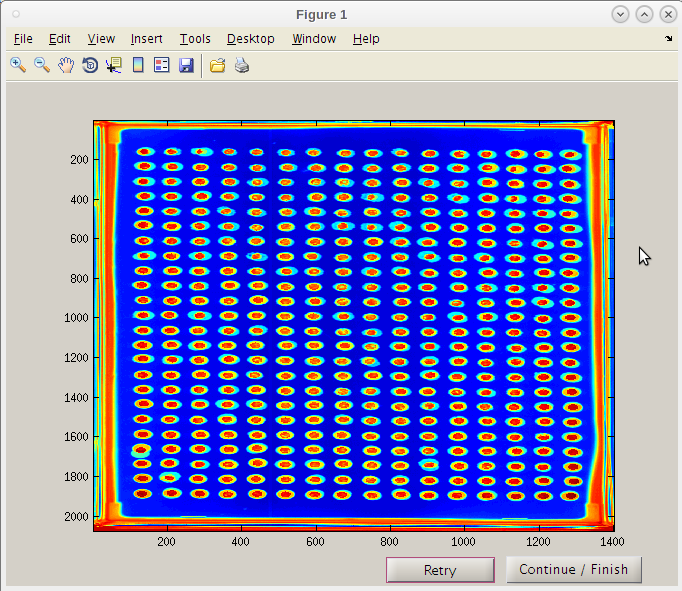
- Even though the first result image using 126 may have given a good map, we will use the improve second initiation point by clicking the 'Continue/Finish' button.
- Note that the red “hot” spot is now well centered in each composite image spot.
- We can now click 'Continue / Finish' to proceed.
- The coordinates and parameters will be stored in the results folder 'PTmats'.
- This is where the .mat files which contain localization data for use in the next section of our work.
- The EASY GUI will come back.
- Now click the 'Run' → 'Image Curve ComboAnalysi'.
- This will perform the image quantification and then generate the curve fits for each plate selected.
- Typically we pick only one plate at a time for one or two master plates.
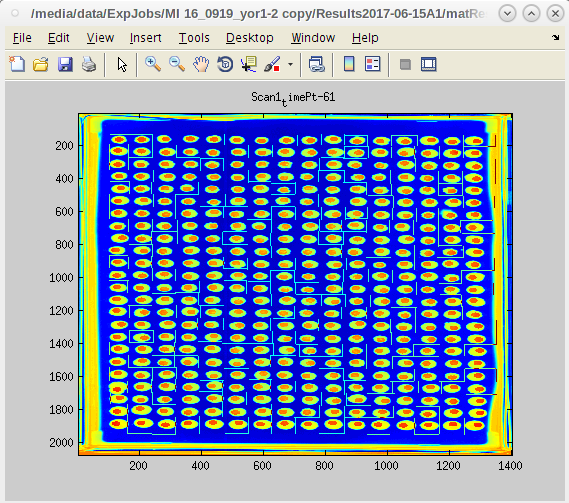
- The software will present the final image of the search if only 1 master plate is selected.
- If multiple plates are selected, no search images will be presented or stored as figures.
- However all the position data for every spot at every time point will be stored.
- This large data trove is used by EZview to produce the image click-on hot spot maps and the photo strips.
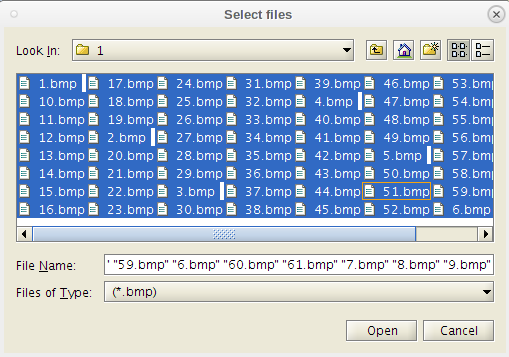
- Note the 'Select Files' dialog.
- It allow the user to select the specific .bmp files to use.
- This can be useful if there are bad ones that need to be removed from the folder due to contamination.
- If all are good we can select them all and click 'Open' to run the process.
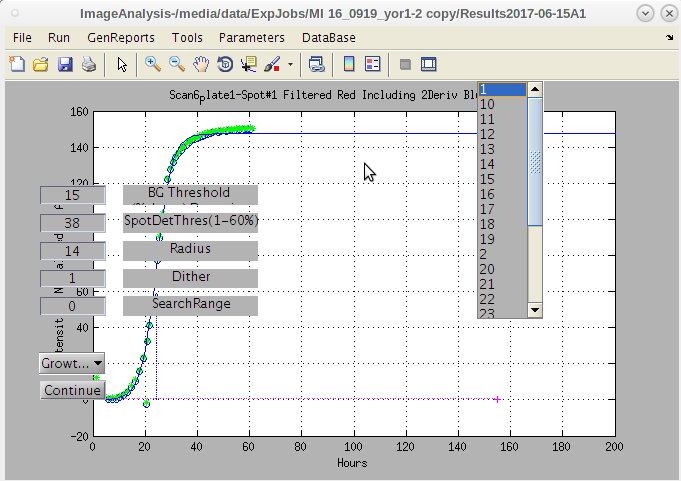
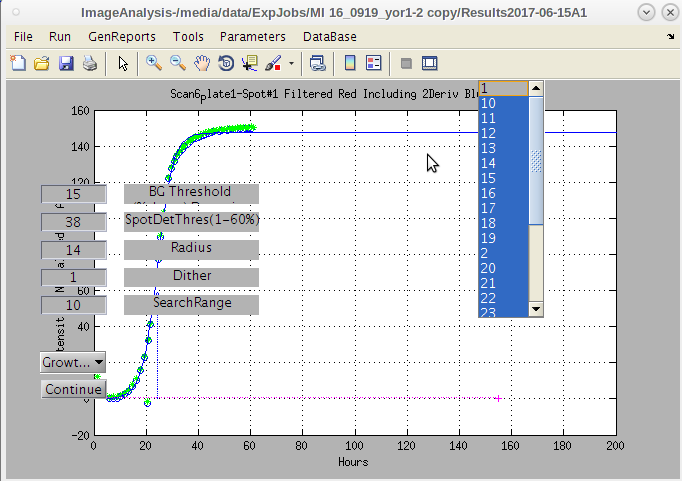
- There are other parameters that can be selected.
- For now we will continue and come back to those later.
- The search focus of each spot at the end of the run is presented for examination
- Notice that these have floated and locked in to a position determined on the fly to a point where the initial growth has exceed has reach a point of maturity.
- This prevents a jump to a late onset jump to a contamination site.
- If we found that we need to adjust our pin tool map or make other modifications, we can do that and rerun these single runs until we are satisfied.
- Next we will run the entire experiment by clicking on all the other master plates from the list box.
- Depending on the number of master plates and the number of time point images taken for each, this next step can take a while.
- Click continue and do something else while the computer works.
- When the work is complete the EASY GUI will reappear without the master plate list.
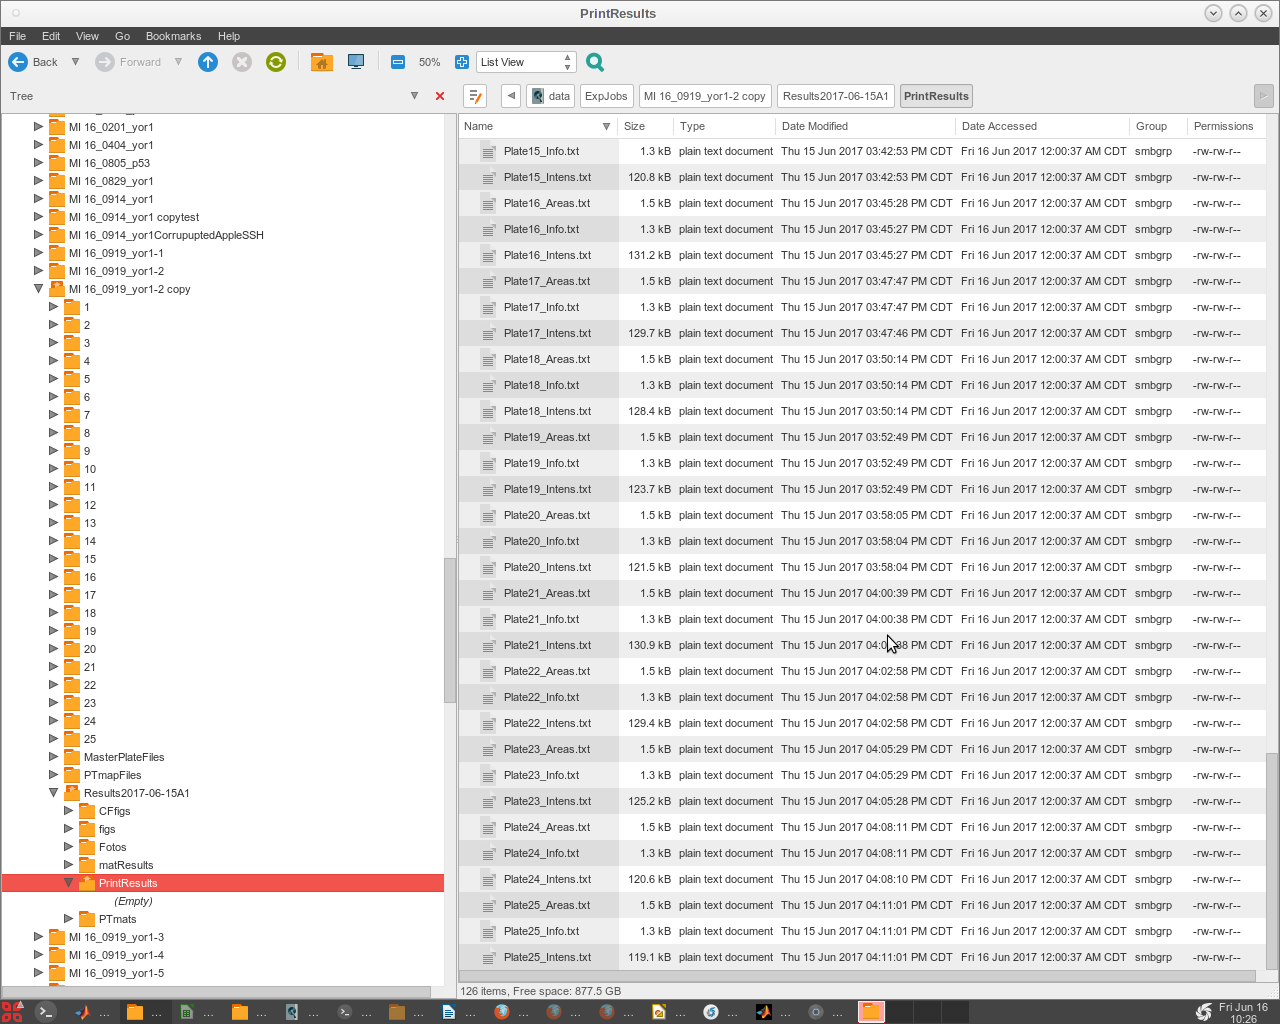
- Now look in the /Results* /PrintResults folder to check that all the plates have run and produced data.
- This is a legacy print copy of data, but is still useful to check that all the quantification was completed successfully.
Generate Reports
- Generate a MPDM.mat file from the Excel master plate and drug media sheets that the user prepared as part of the experiment preparation.
- These sheets must conform to certain format rules.
- It is best when creating these to use a working copy as a template and replace the data with that of the current experiment.
- See Master Plate and Drug-Media Plate topic for details.
- Click on the 'GenReports' menu tab and a drop down menu is presented the the first item 'DrugMediaMP Generate .mat'.
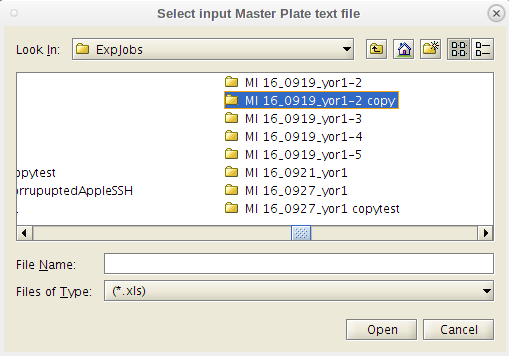
- This will take you to the /MasterPlateFiles folder within the experiment currently being analyzed.
- Do as the dialog box instructs. Select the Master Plate Excel file first.
- Important note: These files (both for master plates and drug-medias) must be generated or converted to the Excel 95 version to be read in Linux.
- This can be done on either a Windows or an Apple machine running Excel.
- A message dialog pops up.
- Click 'OK'.
- Next click on the 'GenReports' menu tab and the second item in the drop down list 'ResultsDB Generate'.
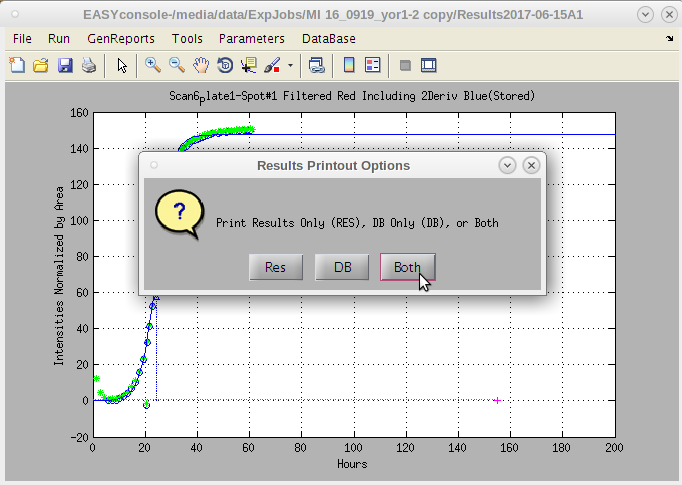
- A dialog box with options appears.
- The default is 'Both'.
- 'Res' produces only a standard result sheet in the current experiments /Results*/PrintResults folder.
- 'DB' produces only a special file for convenient upload to databases.
- This file has no blank rows separating the plates and combines the raw data for each line item into a 'blob' as this is a convenient way to store data of variant lengths in a single database field.
- The concatenation of data for each row take a while. But is useful for uploading data.
Typically 'Both' is the preferred option, however, if one needs to review the results quickly, this provides that option.
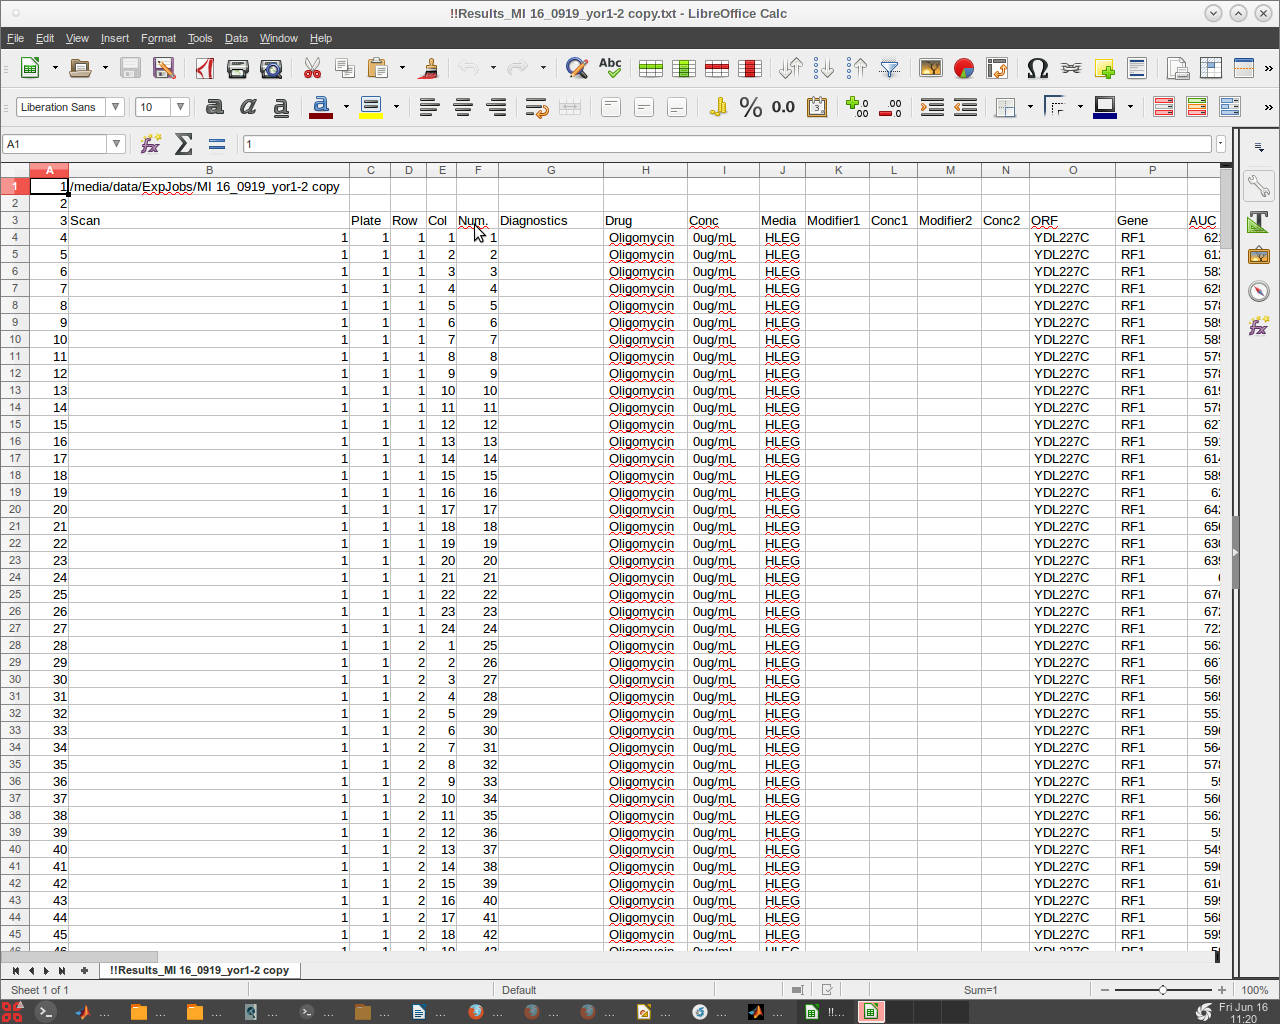
We can open the !!Results MI 16_0919 yor1-1 copy.txt text file using Libre Open Office to review the results.
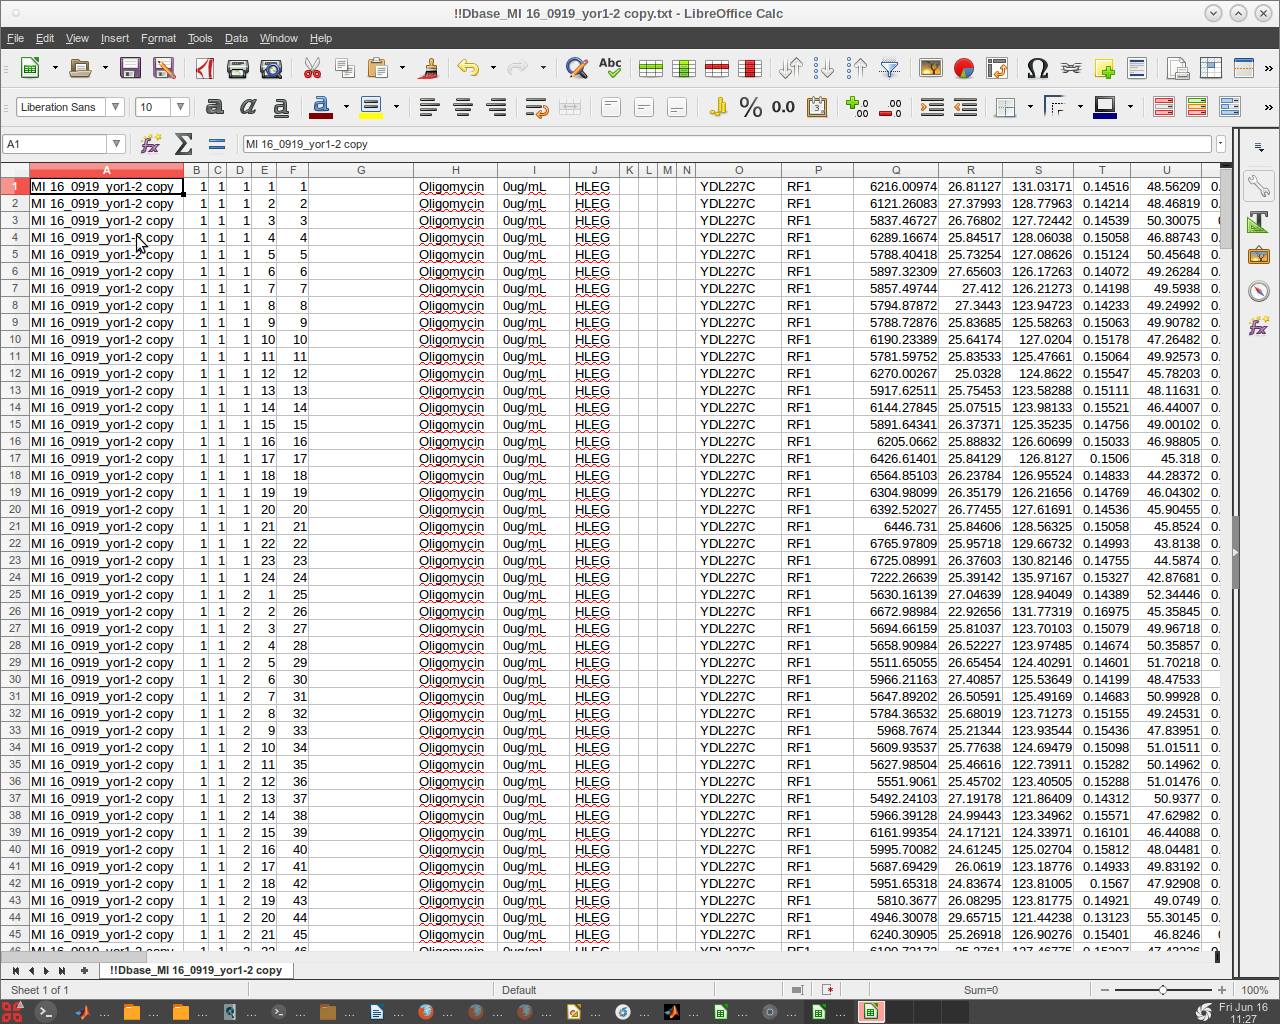
- We can do likewise with the !!Dbase_MI 16_0919_yor1-2 copy.txt text file.
- Note that there are no headers or empty rows.
- Since Libre may corrupt the text files, it could be advisable to only read them and refrain from any 'Save' options presented.
Master Plate and Drug Media Spreadsheets
- The Master Plate and Drug- Media Spreadsheets correlate to the collected and calculated data with the defining definitions of the cultures, drugs and media involved in producing the experimental data.
- These spreadsheets have a very specific format which was instigated at the beginning of our work.
- To maintain compatibility over the years, we maintain that format.
- To begin with, our system can be used with Windows, Linux and Apple operating systems.
- To accommodate these OS's, the Excel version must be an older Excel 95 version which is cross compatible for Matlab versions within all three major OS's.
- Windows is more tolerant, but to avoid problems producing results reports, ALWAYS use the Excel 95 format for your spreadsheets.
- Do not remove any header rows. They can be modified with exception of the triple hash (###).
- Do not change the number or order of the columns.
- Next place a 'space' in unused empty spreadsheet entry positions.
- This can cause problems in general for some software utilities.
- It is just best to make this a standard practice.
- Avoid using special characters.
- Depending on the OS and software utility (especially database utilities), these can be problematic.
- Certain 'date' associated entries such as Oct1 or OCT1 will be interpreted by Excel as a date and automatically formatted as such.
- Do not use Oct1 (which is a yeast gene name) instead use Oct1_ or it's ORF name instead.
- When creating a Master Plate spreadsheet, it is best to start with a working spreadsheet template and adjust it to your descriptive data.
- Be sure that ### mark is always present in the first column of the header for each plate.
- This is important convention as it is used to defined a new plate set of entry data.
- Each plate is expected to have 384 rows of data correlated with the 384 wells of the source master plates.
- These have a particular order going through all 24 columns each row before proceeding to the next row.
- Gene names and ORF name entries should be as short as possible (4-5 character max if possible) as these are used repeatedly as part of concatenated descriptors.
- The 'Replicate' field and the 'Specifics' fields can be used for additional information.
- The 'Replicate' field was originally designed to allow the user to sort replicates but it can be used for other relevant information.
- The 'Specifics' field was created to handle special cases where the liquid media in which cultures were grown on a single source plate was selectively varied.
- This gives the researcher a way to sort by growth media as well as gene or ORF name.
- It can also be used to sort other properties instead of modifying the gene name field.
- Thoughtful experiment design and layout are important for the successful analysis of the resultant data.
- It is typically a good idea to create at least one reference full plate and make that plate the first source master plate.
- Typically we give those reference cultures the 'Gene Name' RF1.
- Traditionally we also made a second full reference plate with its cultures labeled RF2.
- More recently some researchers have gone to dispersing RF1 control reference cultures throughout the source master plates series in addition to the first full source master plate.
- The EZview software has been updated accordingly to find these references and perform associated calculations.
- There are a number of fields on the spreadsheet which in this case were left empty.
- This spreadsheet format was created originally with studies of whole yeast genome SGA modifications incorporated.
- Therefore all fields may not be relevant.
- However, when ever relevant it is strongly advised to fill in all the appropriate data.
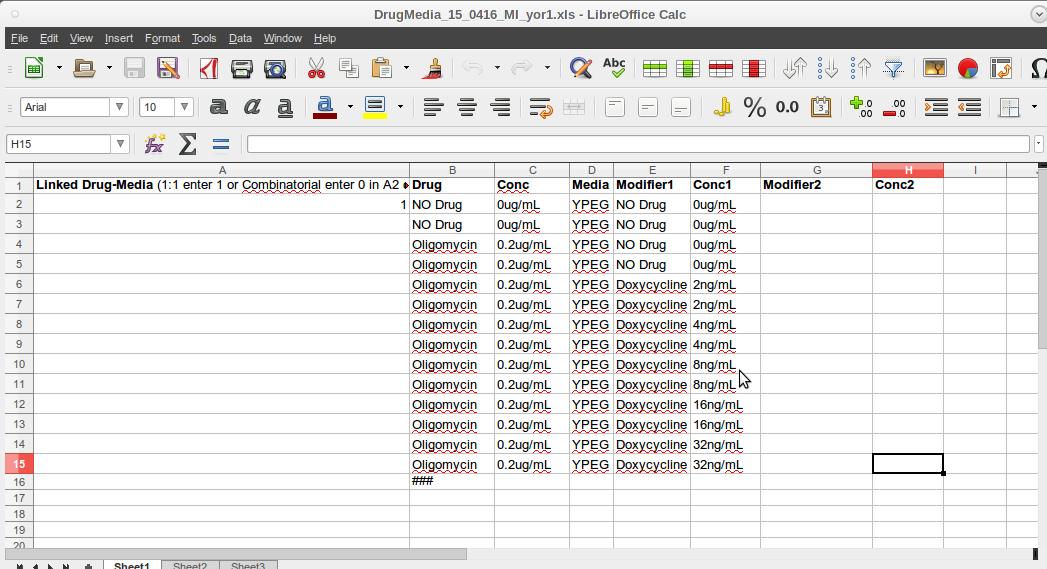
- The Drug-Media spreadsheet defines the perturbation components of each type of agar plate that the source master plates are printed on.
- Again the format adherence is essential.
- There is a '1' in the first column- second row (A2).
- This has as legacy going back to early use.
- It is still necessary and should not be deleted.
- The header row must not be deleted.
- A triple hash(###) must be placed in the cell below the last entry in the Drug field (Column 2).
- Again insert a 'space' in each unused or empty cell in each field.
- Again avoid special characters which may cause problems if not in the experiment quantification in subsequent analysis utilities.
- A utility looking for a text field may end up reading a null and respond inappropriately.
- As with the master plate Excel sheet, it is a good idea to use a working copy of an existing Drug-Media spreadsheet and adapt it to ones needs.
To analyze a new Q-HTCP experiment:
- Open the EASY Software.
- Open 'EstartConsole.m' with MATLAB
- Click the Run icon (play button)
- When prompted, click "Change Folder" (do not select "Add to Path").
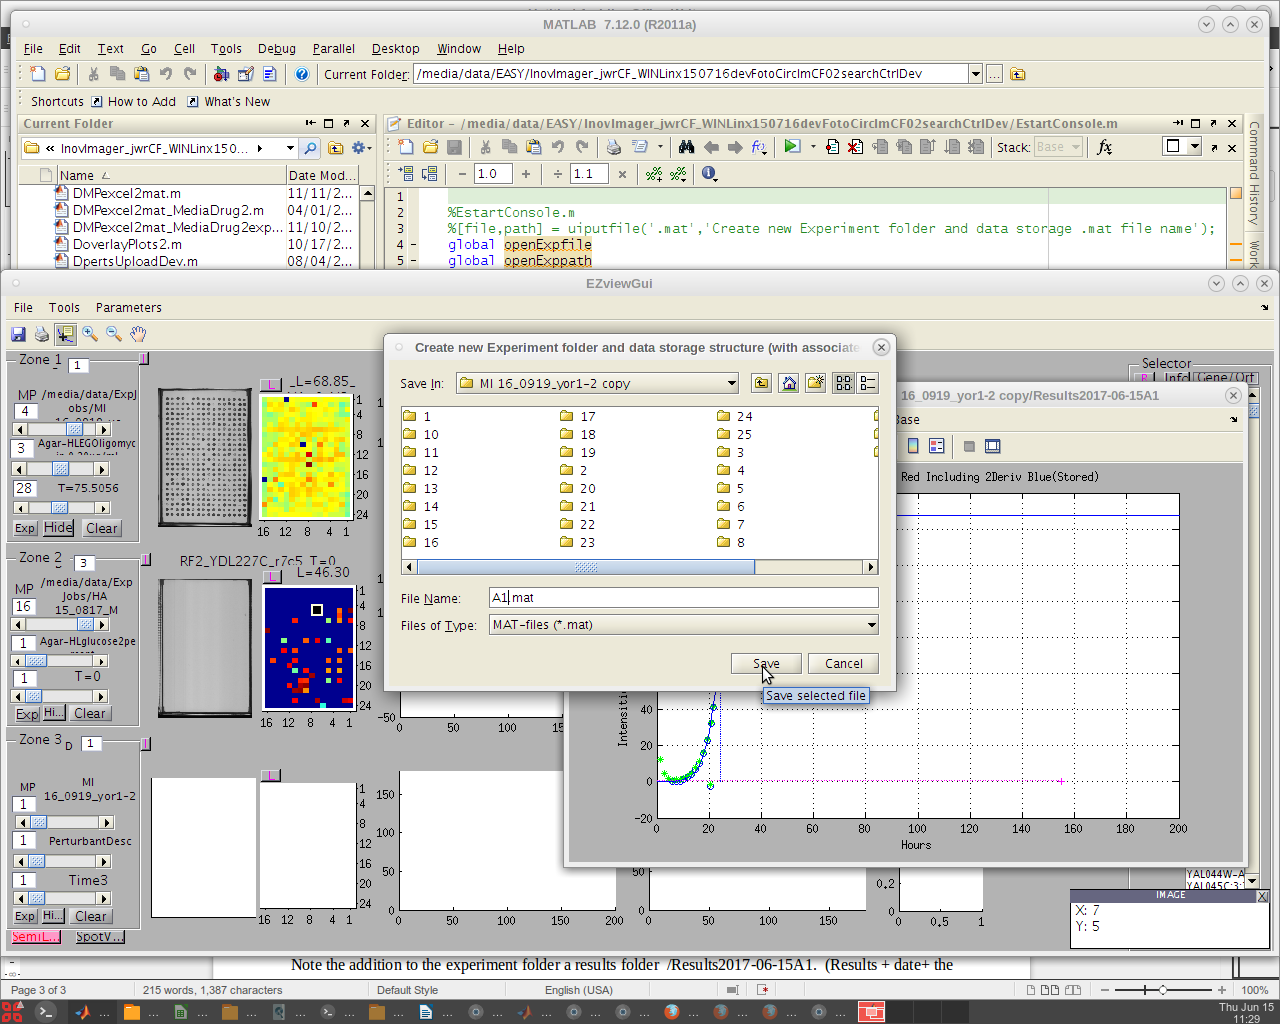
- In the pop-up display, select from the 'File' dropdown: 'New Experiment'.
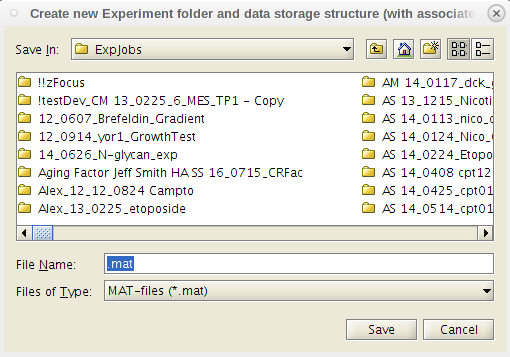
- From the pop-up, choose where to save the new file.
- Navigate to the relevant job in the ExpJobs folder, name the file accordingly, and click 'save'.
- The newly created .mat file in the newly created Results folder will automatically be loaded.
- The file name will then be automatically appended by the code with the current date information (e.g. 'A1.mat' will become 'Results2023-07-19A1)
- If the experiment has already been created, it can be reloaded by clicking 'Load Experiment' instead of 'New Experiment' and selecting the relevant results
- In the pop-up display, click on the 'Run' dropdown menu and select 'Image CurveFit ComboAnalysis'.
- In the updated pop-up, choose/highlight all desired image folders for analysis (this is generally all of the folders, since only the ones that need analysis should be there) and then click on 'continue'.
- As the program is running, updates will periodically appear in the Command Window; there will be an initial pause at "Before call to NIscanIntens…..".
- When the curve fitting is finished, the EASY console will pop back up.
- Check to see the completed analysis results in the newly created 'PrintResults' Folder, inside of the 'Results' Folder.
- Other folders ('CFfigs', 'figs', 'Fotos') are created for later optional use and will be empty.
- NOTE: The image analysis is completed independent of labeling the data (strains, media type, etc. Labeling happens next with the 'GenReports' function).
- Click on the 'GenReports' dropdown and select 'DrugMediaMP Generate .mat'
- NOTE: The 'MasterPlate' and 'DrugMedia' files have very specific formats and should be completed from a template.
- The Masterplate file must be exact (it must contain all and only the strains that were actually tested).
- For example, if only part of a library is tested, the complete library file must be modified to remove irrelevant strains.
- You will be prompted to first select the 'MasterPlate' file. You will need to navigate away from the working directory to get to it.
- It is fine for the 'MasterPlate_' file to be .xlsx (or .xls), and if you don't see it in the popup window, then change the file type from '.xls' to "all files" and then select it.
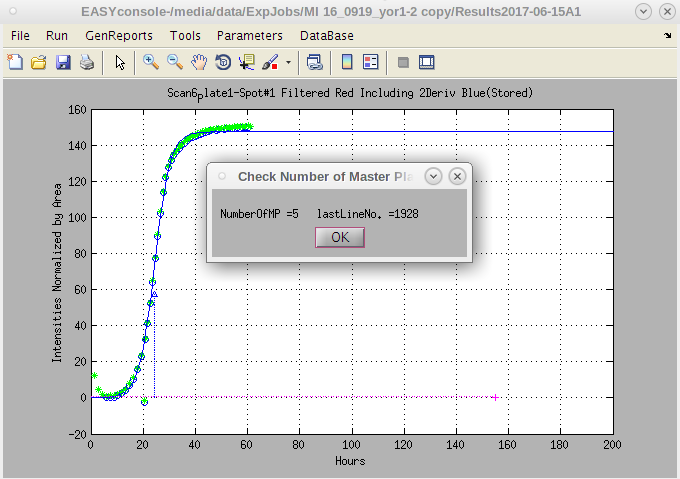
- Once it is selected, a report of the number of master plates in the file will pop up; when the report appears, assuming it is correct, click on 'OK'.
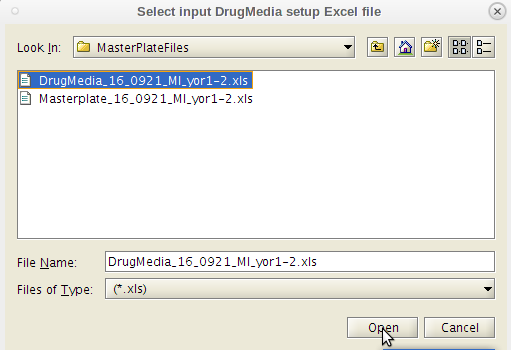
- You will then be prompted to select the 'DrugMedia' file from the relevant job folder. You will automatically return to the correct prior directory location.
- Choose it and click 'OK'. You may see a warning about column headers being modified, but that's ok.
- This will create an additional file in the 'MasterPlatesFiles' folder named 'MPDMmat.mat'
- Click on the 'GenReports' dropdown and select 'Results_Generate.'
- You will first see '!!ResultsElr_.txt' generated in the 'PrintResults' folder.
- Refreshing will reveal an increasing file size until you see the '!!ResultsStd_.txt' being generated.
- When finished, the '!!ResultsStd_.txt' will be about the same file size and it should be used in the following StudiesQHTCP analysis.
- 'NoGrowth.txt', and 'GrowthOnly.txt' files will be generated in the 'PrintResults' folder.
Issues:
- We need full documentation for all of the current workflow. There are different documents that need to be integrated. This will need to be updated as we make improvements to the system.
- MasterPlate_ file must have ydl227c in orf column, or else it Z_interaction.R will fail, because it can't calculate shift values.
- Make sure there are no special characters; e.g., (), “, ', ?, etc.; dash and underscore are ok as delimiters
- DrugMedia file must have letter character to be read as 'text'.
- MasterPlate_ file and DrugMedia_ are .xlsx or .xls, but !!Results_ is .txt.
- In Z_interactions.R, does it require a zero concentration/perturbation (should we use zero for the low conc, even if it's not zero), e.g., in order to do the shift correctly.
- Need to enable all file types (not only .xls) as the default for GenerateResults (to select MP and DM files as .xlsx).
- Explore differences between the ELR and STD files - 24_0414; John R modified Z script to format ELR file for Z_interactions.R analysis.
- To keep time stamps when transferring with FileZilla, go to the transfer drop down and turn it on, see https://filezillapro.com/docs/v3/advanced/preserve-timestamps/
- Could we change the 'MasterPlateFiles' folder label in EASY to 'MasterPlate_DrugMedia' (since there should be only one MP and there is also a DM file required?
- I was also thinking of adding a 'MasterPlateFilesOnly' folder to the QHTCP directory template where one could house different MPFiles (e.g., with and without damps, with and without Refs on all MPs, etc; other custom MPFiles, updated versions, etc)
- Currently updated files are in '23_1011_NewUpdatedMasterPlate_Files' on Mac (yeast strains/23_0914…/)
- For EASY to report cell array positions (plate_row_column) to facilitate analyzing plate artifacts. The MP File in Col 3 is called 'LibraryLocation' and is reported after 'Specifics' in the !!Results.
- Can EASY/StudiesQ-HTCP be updated at any time by rerunning with updated MP file (new information for gene, desc, etc)- or maybe better to always start with a new template?
- Need to be aware of file formatting to avoid dates (e.g., with gene names like MAY24, OCT1, etc, and with plate locations 1E1, 1E2, etc)- this has been less of a problem.
- In StudiesQHTCP folders, remember to annotate Exp1, Exp2, in the StudyInfo.csv file.
- Where are gene names called from for labeling REMc heatmaps, TSHeatmaps, Z-interaction graphs, etc? Is this file in the QHTCP 'code' folder, or is it in the the results file (and thus ultimately the MP file)?
- Is it ok for a MasterPlate_ file to have multiple sheets (e.g., readme tab- is only the first tab read in)?
- What are the rules for pulling information from the MasterPlateFile to the !!Results_ (e.g., is it the column or the Header Name, etc that is searched? Particular cells in the DrugMedia file?).
- Modifier, Conc are from DM sheet, and refer to the agar media arrays. OrfRep is from MasterPlate_ File. 'Specifics' (Last Column) is experiment specific and accommodate designs involving differences across the multi-well liquid arrays. 'StrainBkGrd' (now 'Library location') is in the 3rd column and reported after 'Specifics' at the last col of the '!!Results..' file.
- Do we have / could we make an indicator- work in progress or idle/complete with MP/DM and after gen-report. Now, we can check for the MPDMmat.mat file, or we can look in PrintResults, but would be nice to know without looking there.
- File>>Load Experiment wasn't working (no popup to redirect). Check this again.
ezview
TODO WIP
qhtcp
System for Multi-QHTCP-Experiment Gene Interaction Profiling Analysis
- Functional rewrite of REMcMaster3.sh, RemcMaster2.sh, REMcJar2.sh, ExpFrontend.m, mProcess.sh, mFunction.sh, mComponent.sh
- Added a newline character to the end of the study info file so it is a valid text file
TODO
- Suggest renaming StudiesQHTCP to something like qhtcp qhtcp_output or output
- Move (hide) the study template somewhere else
- StudiesArchive should be smarter:
- Create a database with as much information as possible
- Write a function that easily loads and parses databse into easy-to-use variables
- Allow users to reference those variables to write their own modules
- Should not be using initials
- not unique enough and we don't have that data easily on hand
- usernames are unique and make more sense
- I don't know what all would have to be modified atm
Rerunning this module uses rsync --update to only copy files that are newer in the template If you wish for the template to overwrite your changes, delete the file from your QHTCP project dir
To create a new study (Experiment Specific Interaction Zscores generation)
- StudyInfo.csv instructions:
- In your files directory, open the /Code folder, edit the 'StudyInfo.csv' spreadsheet, and save it as a 'csv' file to give each experiment the labels you wish to be used for the plots and specific files.
- Enter the desired Experiment names- **order the names in the way you want them to appear in the REMc heatmaps; and make sure to run the front end programs (below) in the correct order (e.g., run front end in 'exp1' folder to call the !!Results file for the experiment you named as exp1 in the StudyInfo.csv file)
The GTA and pairwise, TSHeatmaps, JoinInteractions and GTF Heatmap scripts use this table to label results and heatmaps in a meaningful way for the user and others. The BackgroundSD and ZscoreJoinSD fields will be filled automatically according to user specifications, at a later step in the QHTCP study process.
MATLAB ExpFrontend.m was made for recording into a spreadsheet ('StudiesDataArchive.txt') the date and files used (i.e., directory paths to the !!Results files used as input for Z-interaction script) for each multi-experiment study. Give each experiment the labels you wish to be used for the plots and specific files. Enter the desired Experiment names and order them in the way you want them to appear in the REMc heatmaps; Run the front end MATLAB programs in the correct order (e.g., run front end in 'exp1' folder to call the !!Results file for the experiment you named as exp1 in the StudyInfo.csv file)
The GTA and pairwise, TSHeatmaps, JoinInteractions and GTF Heatmap scripts use this table to label results and heatmaps in a meaningful way for the user and others. The BackgroundSD and ZscoreJoinSD fields will be filled automatically according to user specifications, at a later step in the QHTCP study process.Open MATLAB and in the application navigate to each specific /Exp folder, call and execute ExpFrontend.m by clicking the play icon.
Use the "Open file" function from within Matlab.
Do not double-click on the file from the directory.
When prompted, navigate to the ExpJobs folder and the PrintResults folder within the correct job folder.
Repeat this for every Exp# folder depending on how many experiments are being performed.
Note: Before doing this, it's a good idea to compare the ref and non-ref CPP average and median values. If they are not approximately equal, then may be helpful to standardize Ref values to the measures of central tendency of the Non-refs, because the Ref CPPs are used for the z-scores, which should be centered around zero.
This script will copy the !!ResultsStd file (located in /PrintResults in the relevant job folder in /scans **rename this !!Results file before running front end; we normally use the 'STD' (not the 'ELR' file) chosen to the Exp# directory as can be seen in the “Current Folder” column in MATLAB, and it updates 'StudiesDataArchive.txt' file that resides in the /StudiesQHTCP folder. 'StudiesDataArchive.txt' is a log of file paths used for different studies, including timestamps.
Do this to document the names, dates and paths of all the studies and experiment data used in each study. Note, one should only have a single '!!Results…' file for each /Exp_ to prevent ambiguity and confusion. If you decide to use a new or different '!!Results…' sheet from what was used in a previous “QHTCP Study”, remove the one not being used. NOTE: if you copy a '!!Results…' file in by hand, it will not be recorded in the 'StudiesDataArchive.txt' file and so will not be documented for future reference. If you use the ExpFrontend.m utility it will append the new source for the raw !!Results… to the 'StudiesDataArchive.txt' file.
As stated above, it is advantageous to think about the comparisons one wishes to make so as to order the experiments in a rational way as it relates to the presentation of plots. That is, which results from sheets and selected 'interaction … .R', user modified script, is used in /Exp1, Exp2, Exp3 and Exp4 as explained in the following section.
TODO MUST CLEAN UP QHTCP TEMPLATE DIRECTORY
As stated earlier, the user can add folders to back up temporary results, study-related notes, or other related work. However, it is advised to set up and use separate STUDIES when evaluating differing data sets whether that is from experiment results files or from differing data selections in the first interaction … .R script stage. This reduces confusion at the time of the study and especially for those reviewing study analysis in the future.
How-To Procedure: Execute a Multi-experiment Study:
- Consider the goals of the study and design a strategy of experiments to include in the study.
- Consider the quality of the experiment runs using EZview to see if there are systematic problems that are readily detectable.
- In some cases, one may wish to design a 'pilot' study for discovery purposes.
- There is no problem doing that, just take a template study, copy and rename it as XYZpilotStudy etc.
- However, careful examination of the experimental results using EZview will likely save time in the long run.
- One may be able to relatively quickly run the interaction Z scores (the main challenge there is the user creation of customized interaction… .R code.
- I have tried to simplify this by locating the user edits near the top).
remc
remc module for QHTCP
TODO
- Which components can be parallelized?
Arguments
- $1 (string): study info file
gtf
GTF module for QHTCP
Arguments
- $1 (string): output directory
- $2 (string): gene_association.sgd
- $3 (string): gene_ontology_edit.obo
- $4 (string): ORF_List_Without_DAmPs.txt
gta
GTA module for QHTCP
TODO
- *
Arguments
- $1 (string): output directory
- $2 (string): gene_association.sgd
- $3 (string): gene_ontology_edit.obo
- $4 (string): go_terms.tab
- $5 (string): All_SGD_GOTerms_for_QHTCPtk.csv
- $6 (string): zscores_interaction.csv
Wrappers
Wrappers:
- Allow scripts to be called by the main workflow script using input and output arguments as a translation mechanism.
- Only run by default if called by a module.
- Can be called directly with its arguments as a comma-separated string
r_gta
GTAtemplate R script
TODO
- Is GTAtemplate.R actually a template?
- Do we need to allow user customization?
INPUT
- gene_association.sgd
- go_terms.tab
OUTPUT
- Average_GOTerms_All.csv
Arguments
- $1 (string): Exp# name
- $2 (string): ZScores_Interaction.csv file
- $3 (string): go_terms.tab file
- $4 (string): gene_association.sgd
- $5 (string): output directory
r_gta_pairwiselk
PairwiseLK.R R script
TODO
- Move directory creation from PairwiseLK.R to gta module
- Needs better output filenames and directory organization
- Needs more for looping to reduce verbosity
INPUT
- Average_GOTerms_All.csv
Output
*
This wrapper:
- Will perform both L and K comparisons for the specified experiment folders.
- The code uses the naming convention of PairwiseCompareExp’#’-Exp’#’ to standardize and keep simple the structural naming (where ‘X’ is either K or L and ‘Y’ is the number of the experiment GTA results to be found in ../GTAresult/Exp).
- {FYI There are also individual scripts that just do the ‘L’ or ‘K’ pairwise studies in the ../Code folder.}
Arguments
- $1 (string): First Exp# name
- $2 (string): Second Exp# name
- $3 (string): study info file
- $4 (string): output directory
r_gta_heatmaps
TSHeatmaps5dev2.R R script
TODO
- Rename
- Refactor to automatically allow more studies
- Refactor with more looping to reduce verbosity
- Reduce cyclomatic complexity of some of the for loops
Files
Output
*
This wrapper:
- The Term Specific Heatmaps are produced directly from the ../ExpStudy/Exp_/ZScores/ZScores_Interaction.csv file generated by the user modified interaction… .R script.
- The heatmap labeling is per the names the user wrote into the study info file
- Verify that the All_SGD_GOTerms_for_QHTCPtk.csv found in ../Code is what you wish to use or if you wish to use a custom modified version.
- If you wish to use a custom modified version, create it and modify the TSHeatmaps template script (TSHeatmaps5dev2.R) and save it as a ‘TSH_study specific name’.
Arguments
- $1 (string): study info file
- $2 (string): gene_ontology_edit.obo file
- $3 (string): go_terms.tab file
- $4 (string): All_SGD_GOTerms_for_QHTCPtk.csv
- $5 (string): ZScores_interaction.csv
- $6 (string): base directory
- $7 (string): output directory
r_interactions
Run the R interactions analysis (deprecates Z_InteractionTemplate.R)
SCRIPT: interactions.R
TODO
- Parallelization (need to consult with Sean)
- Needs more loops to reduce verbosity, but don't want to limit flexibility
- Replace 1:length() with seq_along()
- Re-enable disabled linter checks
- Reduce cyclomatic complexity of some of the for loops
- There needs to be one point of truth for the SD factor
- Replace most paste() functions with printf()
INPUT
- easy/results_std.txt
NOTES
*
Arguments
- $1 (string): The input results_std.txt
- $2 (string): The zscores directory
- $3 (string): The study info file
- $4 (string): SGD_features.tab
- $5 (integer): experiment number
- $6 (integer): delta SD background value (default: 3)
r_join_interactions
JoinInteractExps3dev.R creates REMcRdy_lm_only.csv and Shift_only.csv
TODO
- Needs more loops to reduce verbosity
INPUT
OUTPUT
- REMcRdy_lm_only.csv
- Shift_only.csv
- parameters.csv
Arguments
- $1 (string): The output directory
- $2 (string): The sd value
- $3 (string): The study info file
java_extract
Jingyu's REMc java utility
Input
- REMcRdy_lm_only.csv
Output
- REMcRdy_lm_only.csv-finalTable.csv
NOTE
- Closed-source w/ hardcoded output directory, so have to pushd/popd to run (not ideal)
Arguments
- $1 (string): The output directory
- $2 (string): ORF_List_Without_DAmPs.txt
- $3 (string): REMcRdy_lm_only.csv
- $4 (string): GeneByGOAttributeMatrix_nofiltering-2009Dec07.tab
- $5 (string): The output file
Exit codes
- 0: if expected output file exists
- 1: if expected output file does not exist
r_add_shift_values
Add shift values back to REMcRdy_lm_only.csv-finalTable.csv and output "REMcWithShift.csv" for use with the REMc heat maps
Arguments
- $1 (string): REMcRdy_lm_only.csv-finalTable.csv
- $2 (string): Shift_only.csv
- $3 (string): study info file
- $4 (string): sd value
r_create_heat_maps
Execute createHeatMaps.R
INPUT
- REMcWithShift.csv
OUTPUT
- compiledREMcHeatmaps.pdf
TODO
- Needs more looping for brevity
Arguments
- $1 (string): The final shift table (REMcWithShift.csv)
- $2 (string): The output directory
r_heat_maps_homology
Execute createHeatMapsAll.R
Arguments
- $1 (string): REMcRdy_lm_only.csv-finalTable.csv
- $2 (string): Shift_only.csv
- $3 (string): The (Yeast_Human_Homology_Mapping_biomaRt_18_0920.csv)
- $4 (string): The output directory
py_gtf_dcon
Perform python dcon portion of GTF
SCRIPT: DconJG2.py
OUTPUT
- 1-0-0-finaltable.csv
Arguments
- $1 (string): Directory to process
- $2 (string): Output directory name
pl_gtf_analyze
Perl analyze wrapper
SCRIPT: analyze_v2.pl
TODO
- Are we just overwriting the same data for all set2 members?
- Why the custom version?
Arguments
- $1 (string): gene_association.sgd
- $2 (string): gene_ontology_edit.obo
- $3 (string): ORF_List_Without_DAmPs.txt
- $4 (string): TODO txt to anaylze? I'm not sure what this is called
pl_gtf_terms2tsv
Perl terms2tsv wrapper
TODO
- Probably should be translated to shell/python
Arguments
- $1 (string): Terms file TODO naming
py_gtf_concat
Python concat wrapper for GTF Concat the process ontology outputs from the /REMcReady_lm_only folder
TODO
- Probably should be translated to bash
Arguments
- $1 (string): output directory name to look for txt files
- $2 (string): output file
r_compile_gtf
Compile GTF in R
Arguments
- $1 (string): gtf output directory
study_info
Creates, modifies, and parses the study info file
TODO
- Needs refactoring
- Ended up combining a few functions into one
Variables set
- STUDIES_NUMS (array): contains Exp numbers
Exit codes
- 0: If one or more studies found
- 1: If no studies found
choose_easy_results
Chooses an EASY scans directory if the information is undefined TODO Standardize EASY output, it's hard to understand TODO eventually we could run this on multiple results dirs simultaneously with some refactoring
Arguments
- $1 (string): directory containing EASY results dirs
Variables set
- EASY_RESULTS_DIR (string): The working EASY output directory
Exit codes
- 0: if successfully choose anEASY results dir
